It’s a common problem for business owners and managers: You’re running a digital marketing campaign, but you’re not exactly sure what you’re getting out of it.
Maybe you’re not receiving regular reports from your marketing team. Or maybe you’re receiving reports, they’re just not very good.
I’ve found a reporting solution that solves these problems. And it’s easy to use. And it’s (mostly) free. It’s Google Data Studio (GDS). Here’s why I recommend it:
1. Google Data Studio integrates with a vast array of digital data sources
Not surprisingly, if you use a Google product like Google Analytics or Google Ads, GDS can pull in the information quickly and easily. But you can use GDS to pull in key stats from Instagram, CallRail, SalesForce and many more. You can access statistics from more than 500 data sets from more than 170 connectors, Google says – take a look at the list here.
For some connections, you’ll have to use a pay service to import your data. But that still can be worthwhile, considering the time GDS saves in the reporting process.
It’s also worth noting that a single GDS report can include data from multiple sources. So if you want a report that shows pay-per-click performance across Google Ads, Microsoft (formerly Bing) Ads and Facebook Ads, you can do it.
2. The reports are dynamic
Many marketers deliver their reports as PDFs, giving you a static view of your results for a given time frame. A marketer using GDS reports can send you a link to a dynamic report that allows you to, for instance, change the reporting time period or enter text into a search box to pull up stats for specific posts or page.
And if you prefer reports delivered as PDFs, you can download a version of any GDS report with two mouse clicks.
3. The reports look great
Of course, we are all serious businesspeople who care about results, not how the results look on a computer screen or a printout.
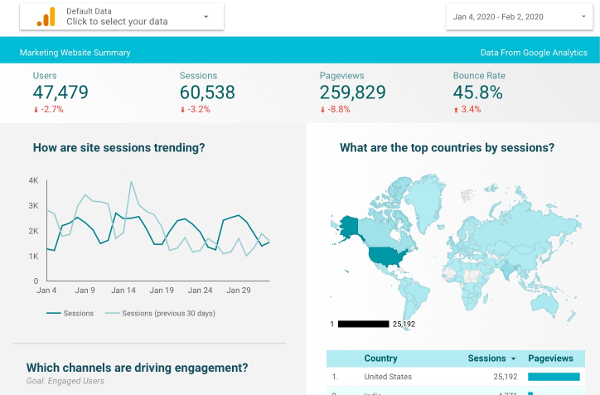
But GDS reports look good. Thanks to GDS’s report template library and its customization features, you don’t have to be a data visualization pro to create an attractive report.
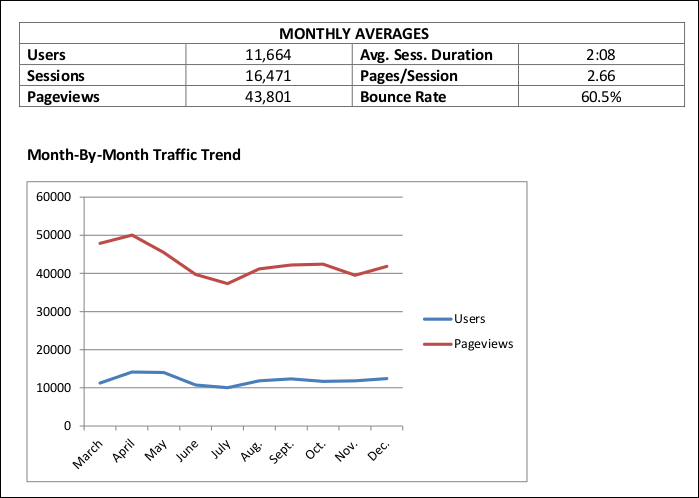
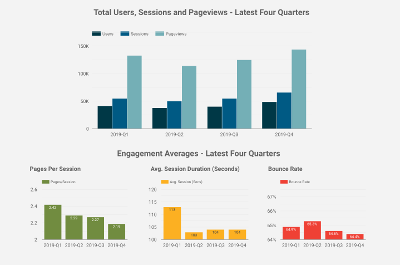
And I’d argue that a report that’s easy on the eyes is easier to understand. I mean, would you prefer this in your inbox:

Or this:

If you have questions about Data Studios, I’d be happy to share my experiences with you. Contact me or leave a comment.

